.png?width=375&height=100&name=WebPage%20logo%20with%20curves%202026%20(8).png)
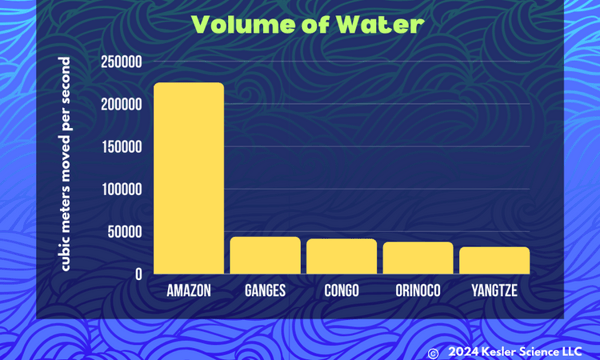
When I say, "Think of the river with the most water," you probably think of freshwater sources like the Amazon. You're mostly right - the river is absolutely massive, as you can see in the graph below.
But what if I said, "What's the largest body of moving water in the world?
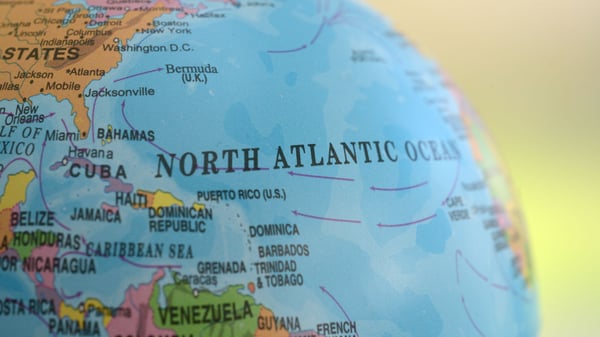
Answer: Okay, it's not a river, exactly. It's the Gulf Stream of the Atlantic Ocean. When you stack this ocean current up against the rivers we've got on land, there's just no comparison.
If we're talking about how much water is in the Gulf Stream, or any river, it's not practical to say how many gallons or liters it contains because the numbers are just too huge. Instead, we measure how much water moves through one spot in the current.
For example: per second, the Amazon River dumps 224,000 cubic meters of water into the ocean. That's enough to fill 83 Olympic swimming pools every single second.
In comparison, per second, the Gulf Stream moves 30 million cubic meters of water through a point in the Straits of Florida.
Here's the volume of the world's largest rivers compared to the Gulf Stream. Notice the change in scale!

It's no wonder that the Gulf Stream has such an important role in the climate around the Atlantic Ocean! The current starts in the Gulf of Mexico and heads across the Atlantic towards the Norwegian Sea. Once it gets up north, the now-cooler water heads towards the equator to start the cycle all over again.
Why is this movement important? The flow of the Gulf Stream creates a milder climate for countries on the northeast side of the Atlantic Ocean by fast-tracking warm water from the east coast of Florida.
How do scientists track the flow of a "river inside an ocean"? They use sea surface temperatures collected from weather satellites like the GOES-R satellites. This site from NOAA has a bunch of cute videos, a poster, and more to teach students about these satellites that track solar flares, lightning strikes, and more.
Scientists have no problem spotting this water moving in a predictable way. The current is truly like a river, pushing through the rest of the ocean water at a respectable pace of 4.6 miles per hour. As a comparison, the Mississippi River moves at a range of 1-3 miles per hour.
I hope you'll explore the NOAA site, and when you're talking about currents and how they affect climate, I hope these graphs will help your students understand the scale of the phenomenon.
For something fun this week, here are links to full-size versions of the graphs that students can hover over. On the second graph, if they hit just the right spots, they can see the volume of the rivers that look like zero values.
River + Gulf Stream volume full-size graph
Enjoy!
- Chris
By the way, if I brought these graphs to my classroom, here are some questions I'd ask my students:
💡After the Amazon, what is the next largest river according to the graphs? How many cubic meters of water move per second in this river?
💡What is the sum of the volumes of the Ganges, Congo, Orinoco and Yangtze rivers? How does this compare to the volume of the Amazon river?
💡How many times bigger is the Gulf Stream compared to the Amazon river?
.png?width=352&name=Frequency%20of%20Behaviors%20in%20Young%20Female%20Dolphins(1).png)
.png?width=352&name=Spookier%20Extinction%20Graph(4).png)